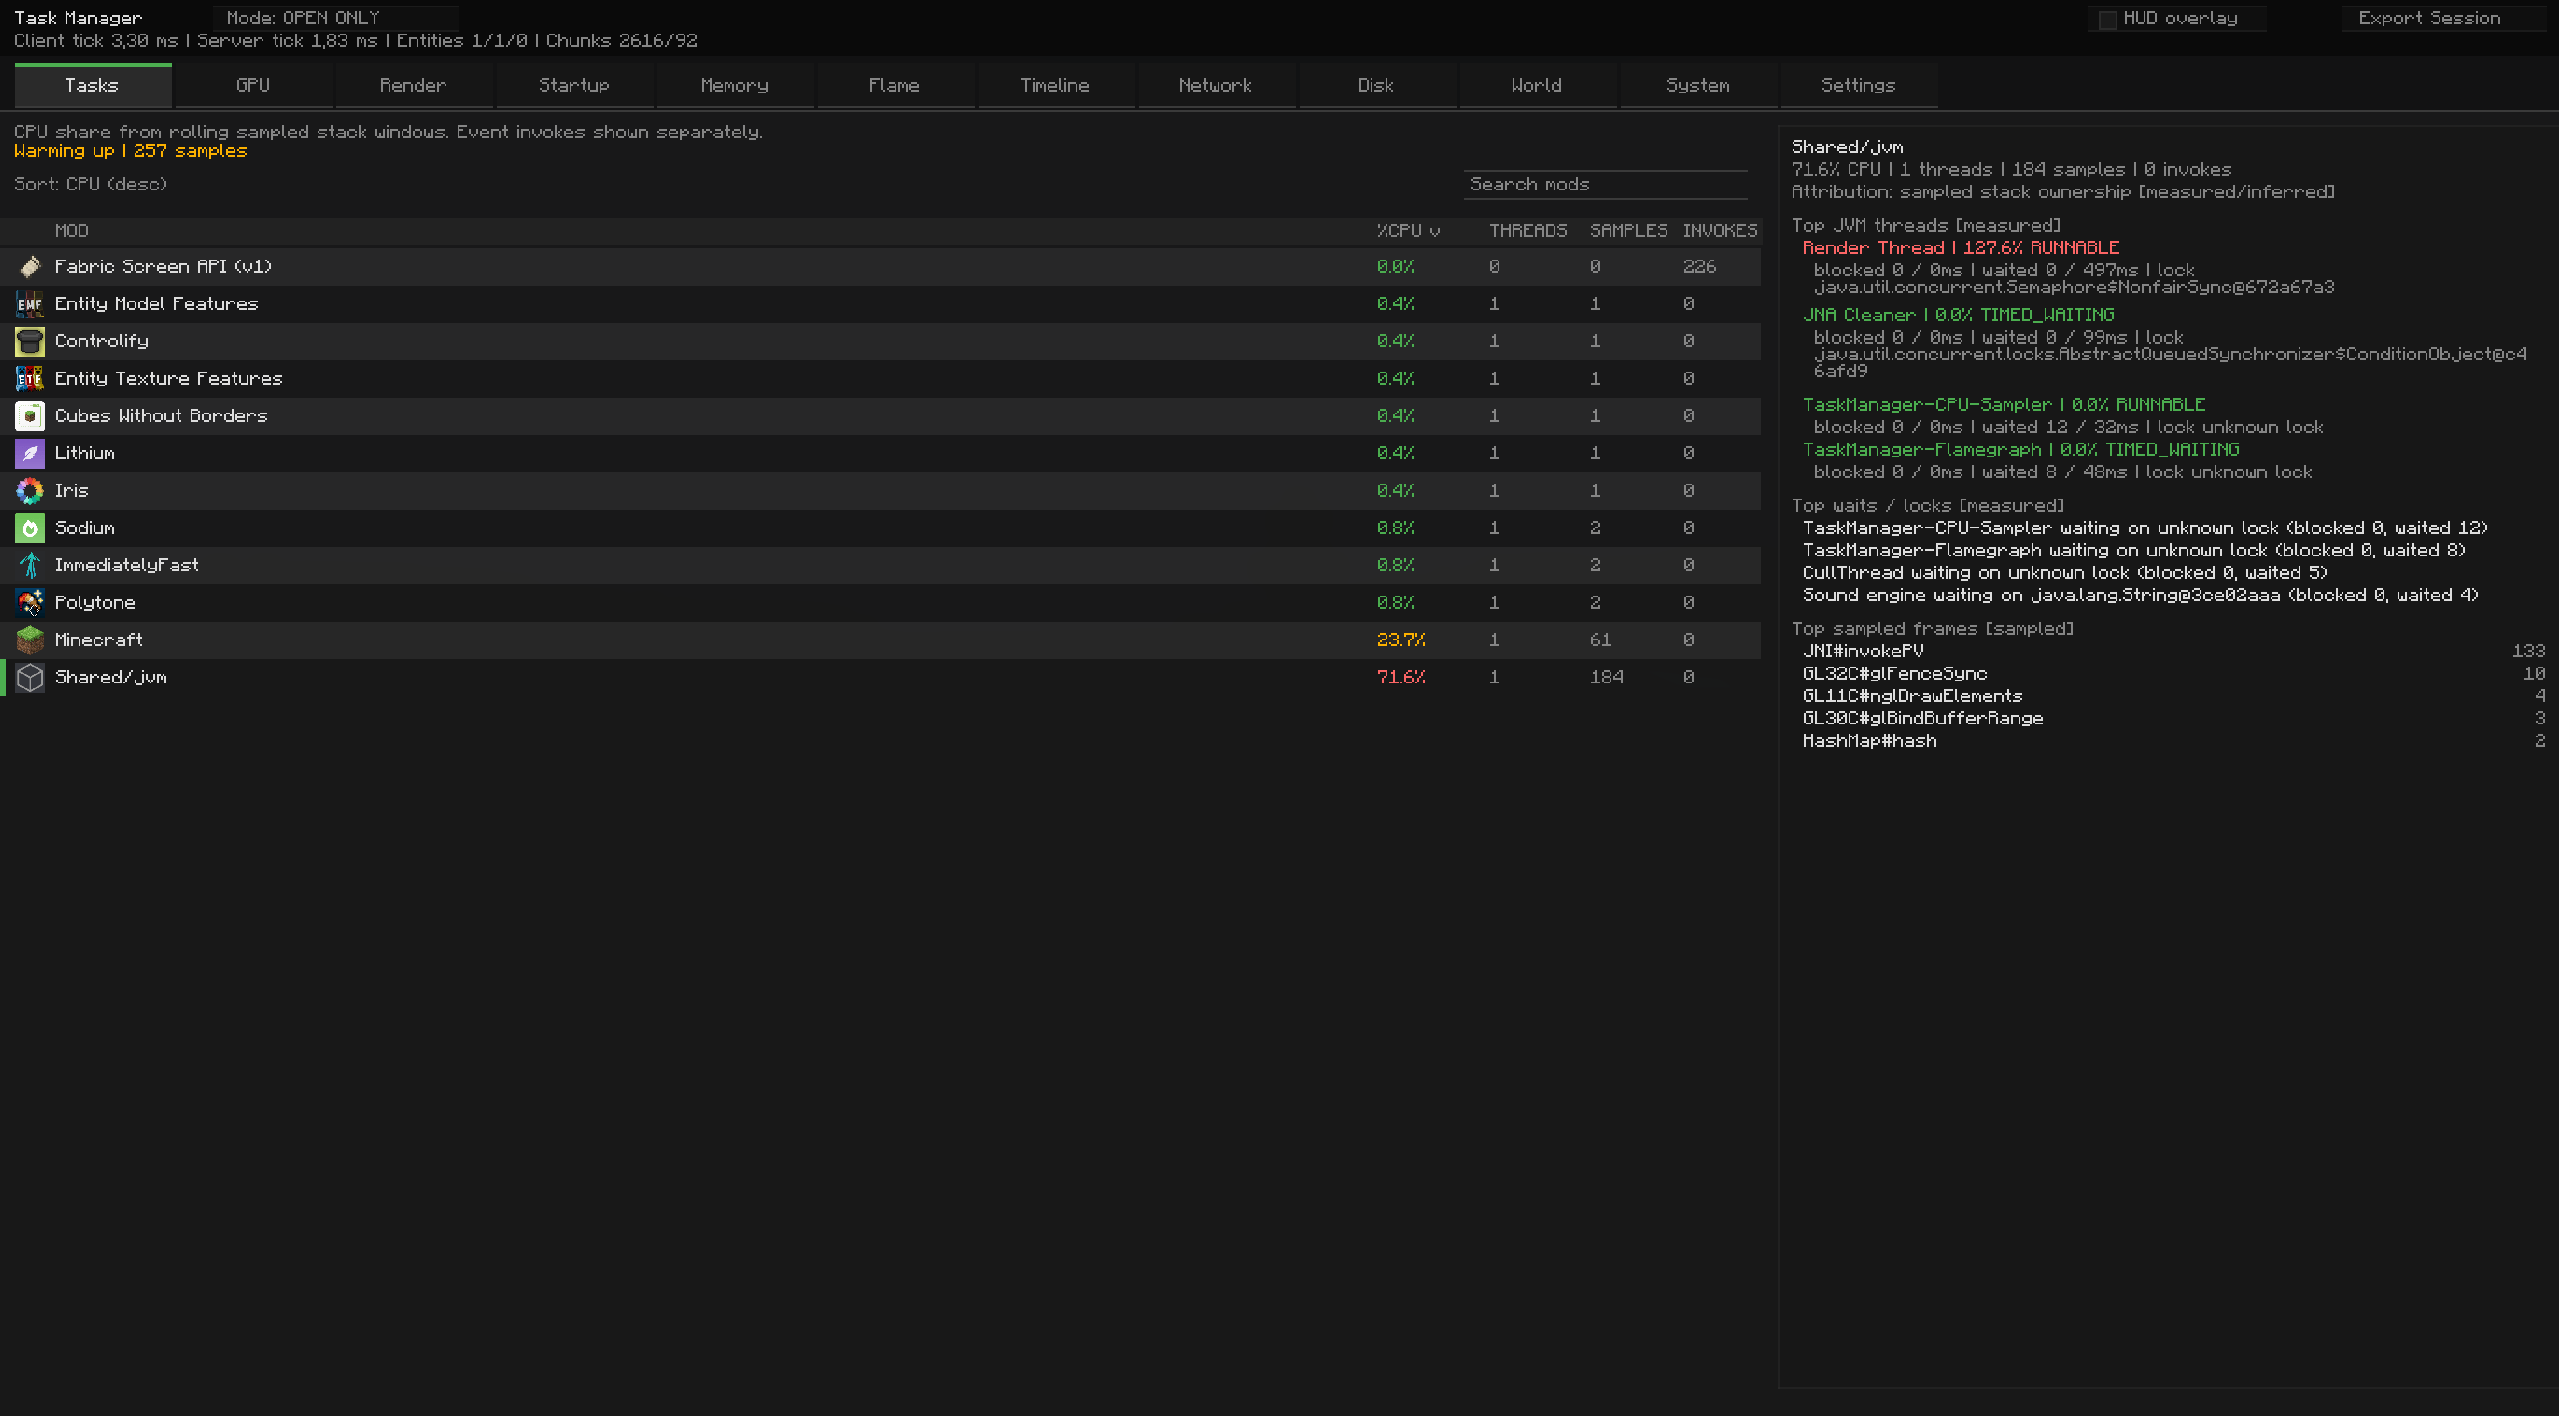
Task Manager is a Fabric client profiler for modded Minecraft that helps you identify frame drops, high MSPT, hot mods, rendering spikes, block-entity pressure, and JVM/runtime issues while the game is still running.
Open the profiler in-game with F12.
Showcase: https://youtu.be/YeJJnLdL9i0
msLag Map and Block Entities mini-tabs
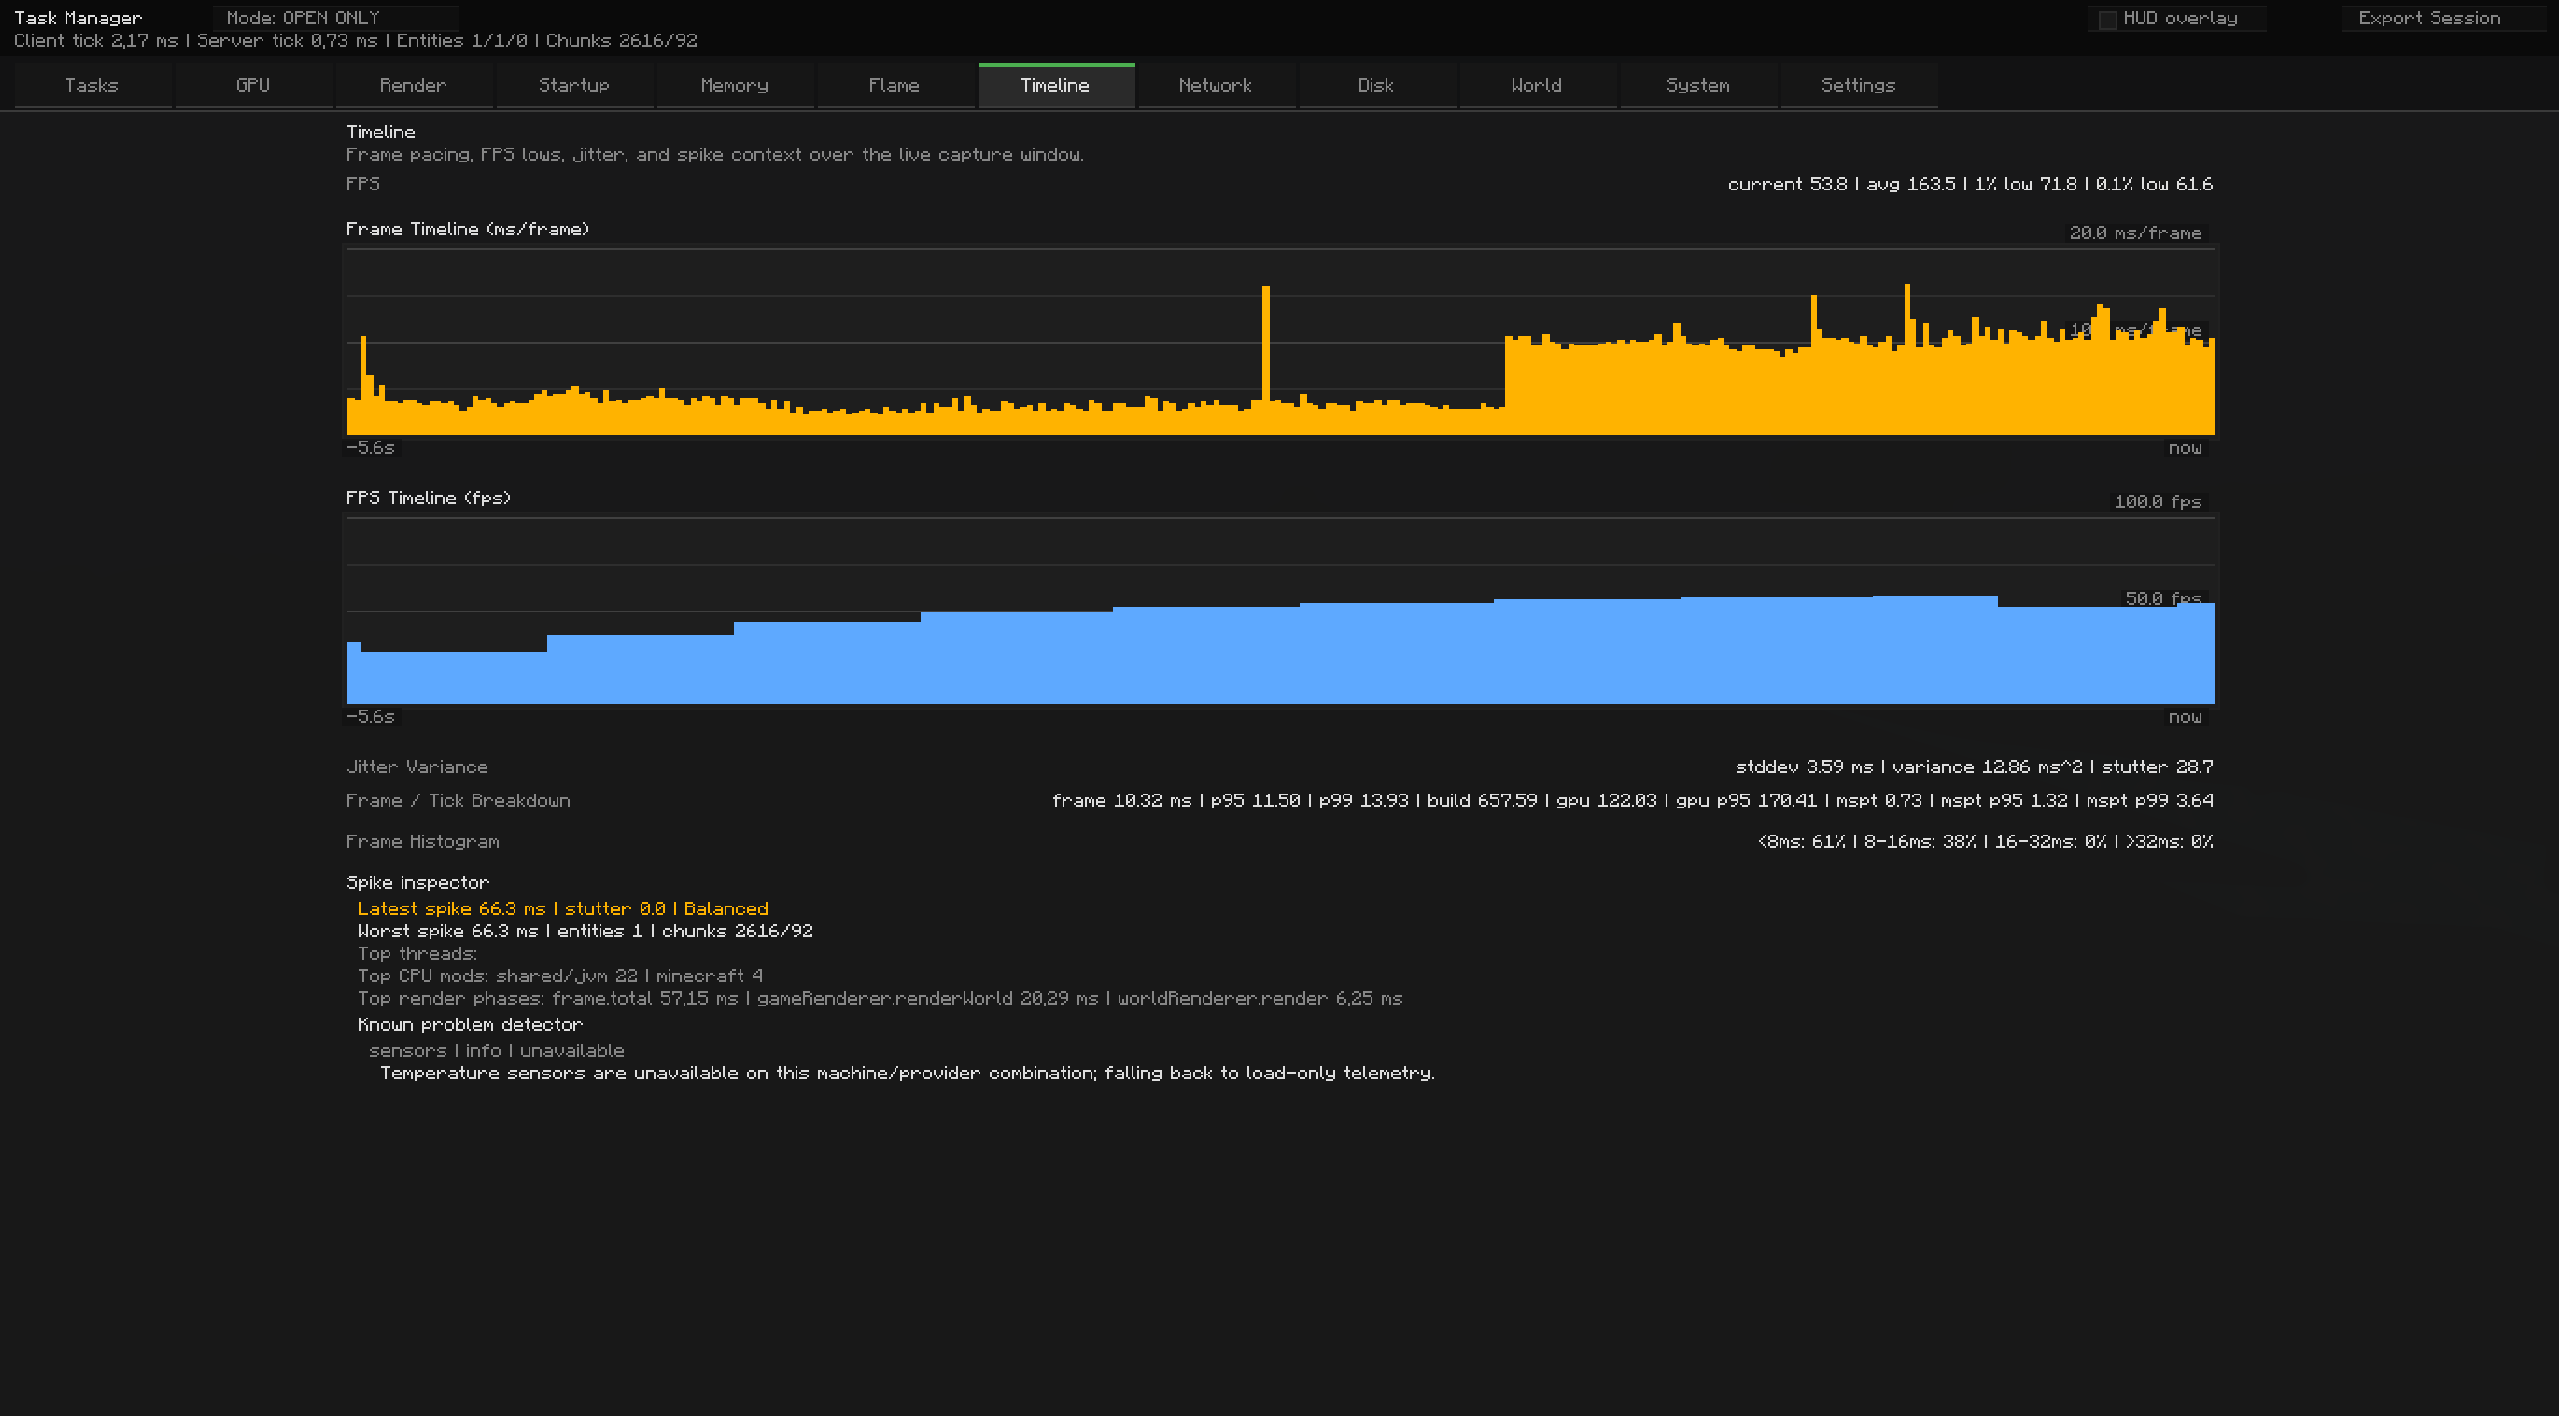
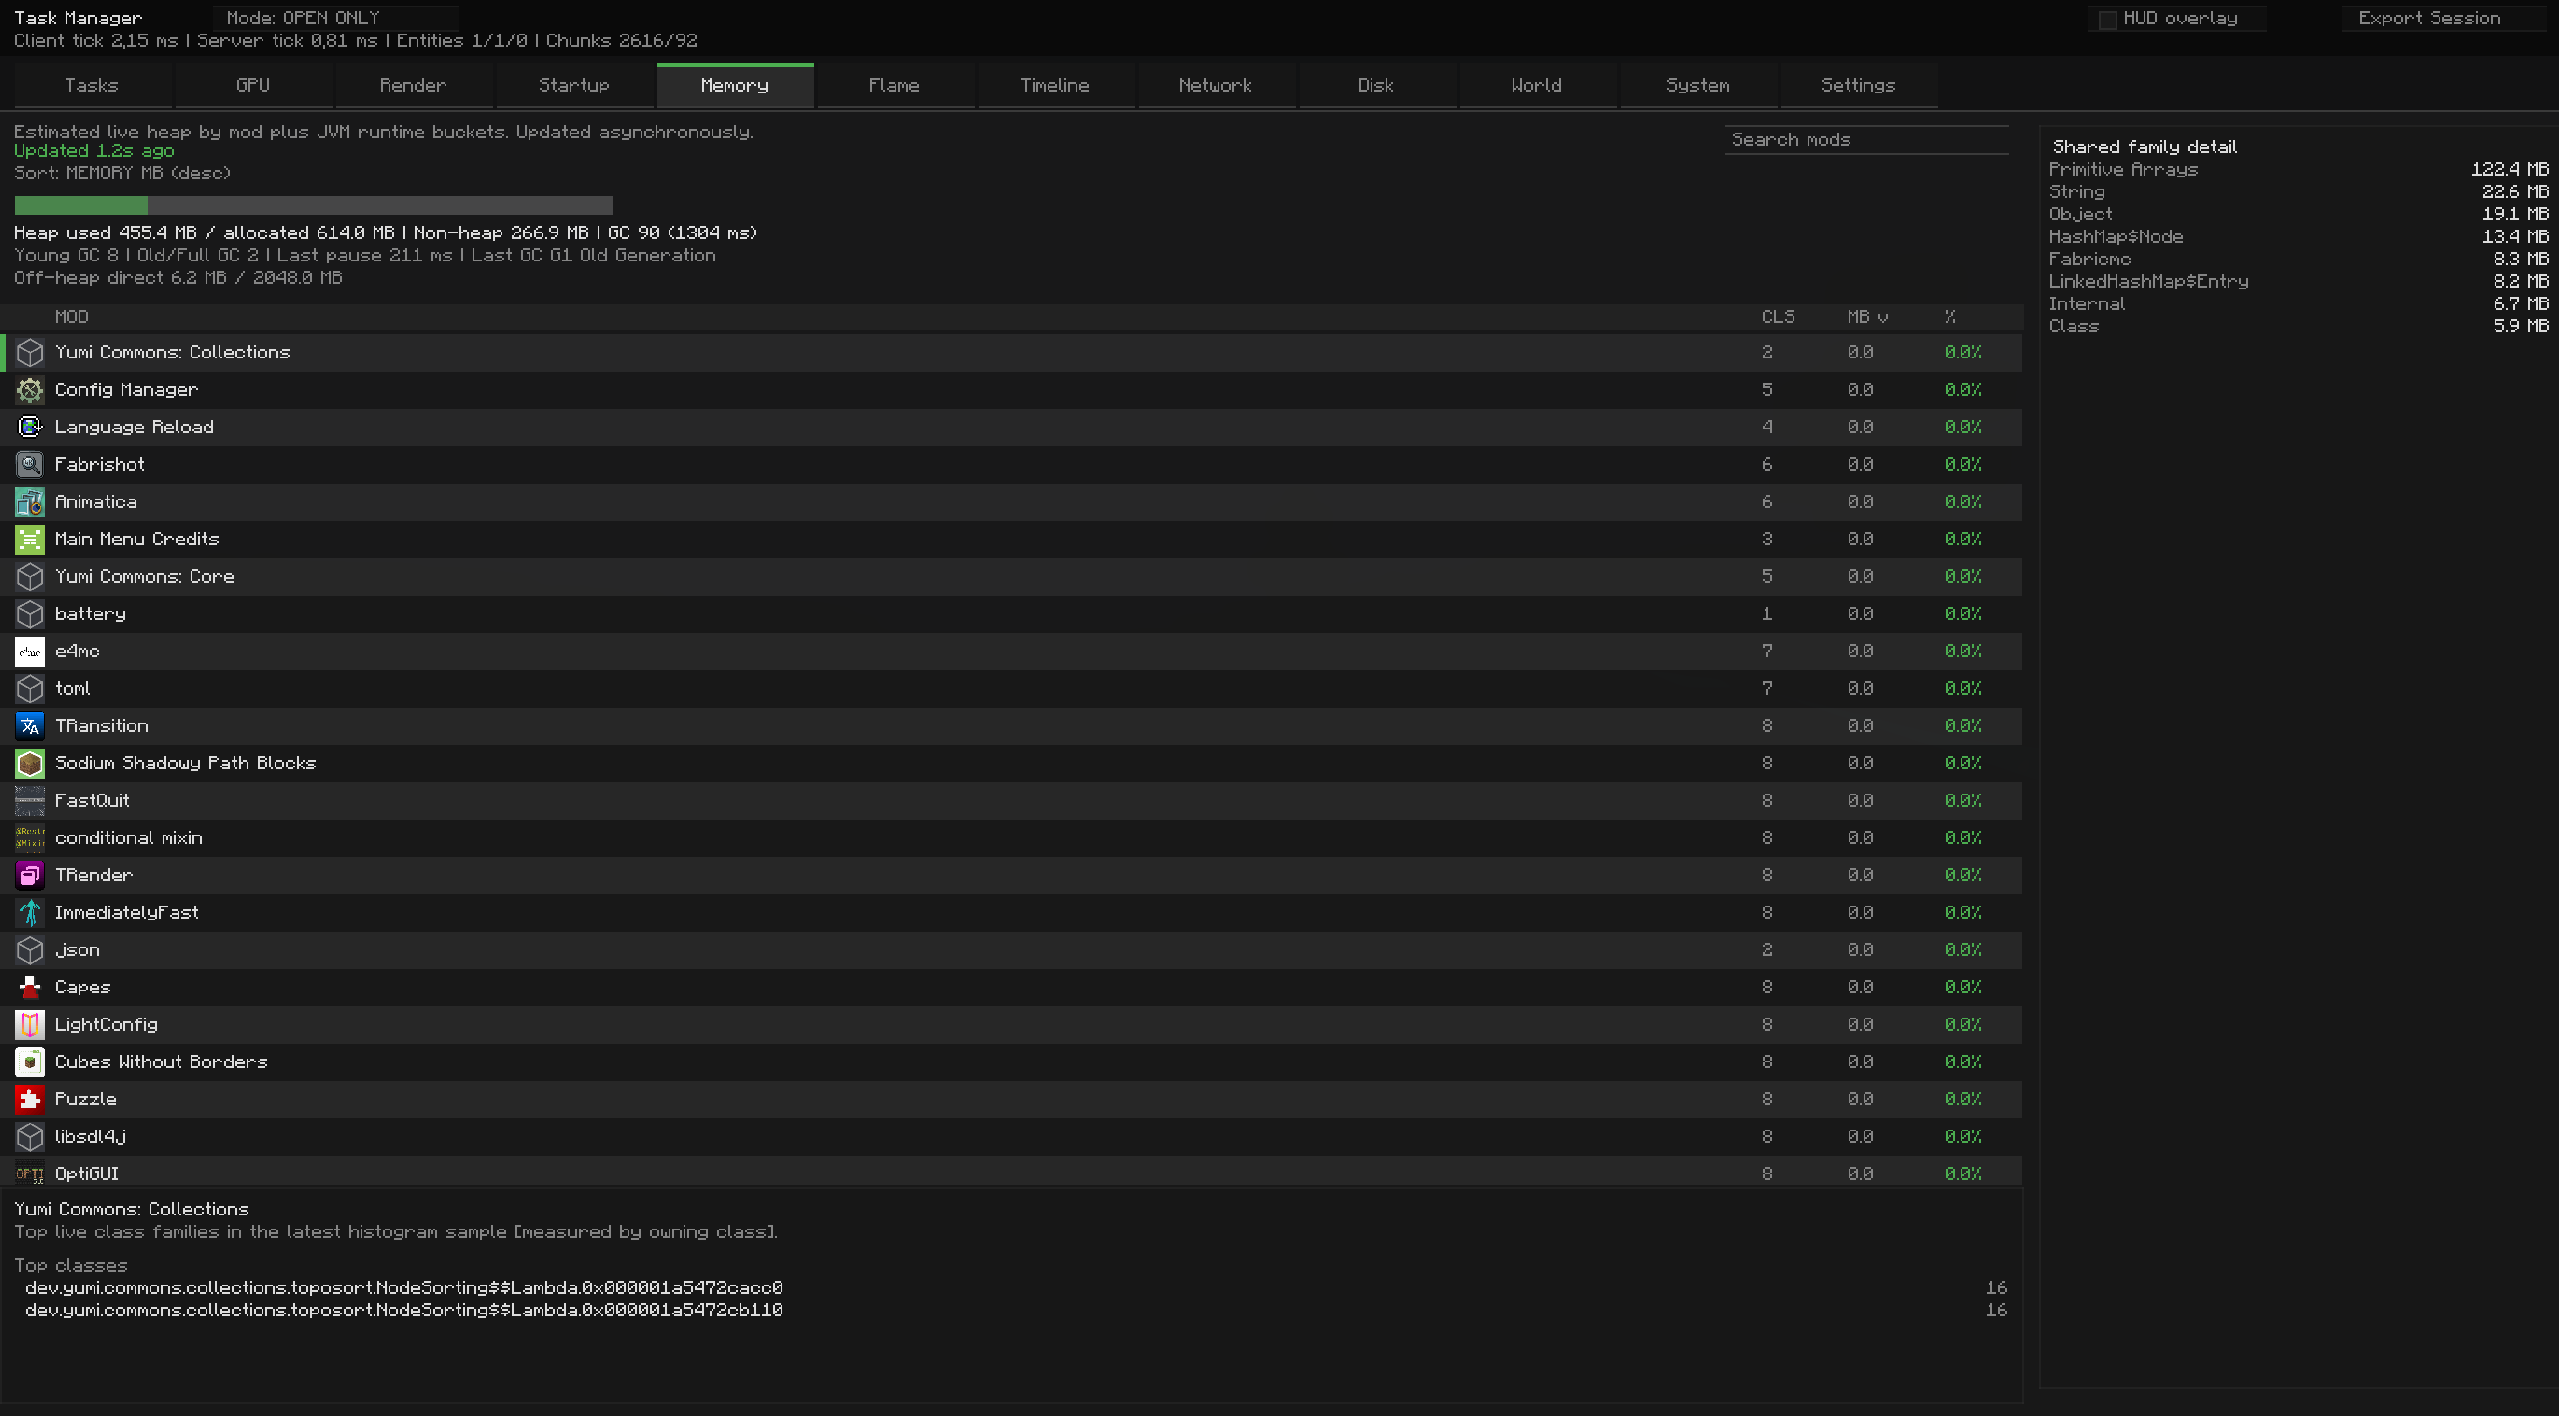
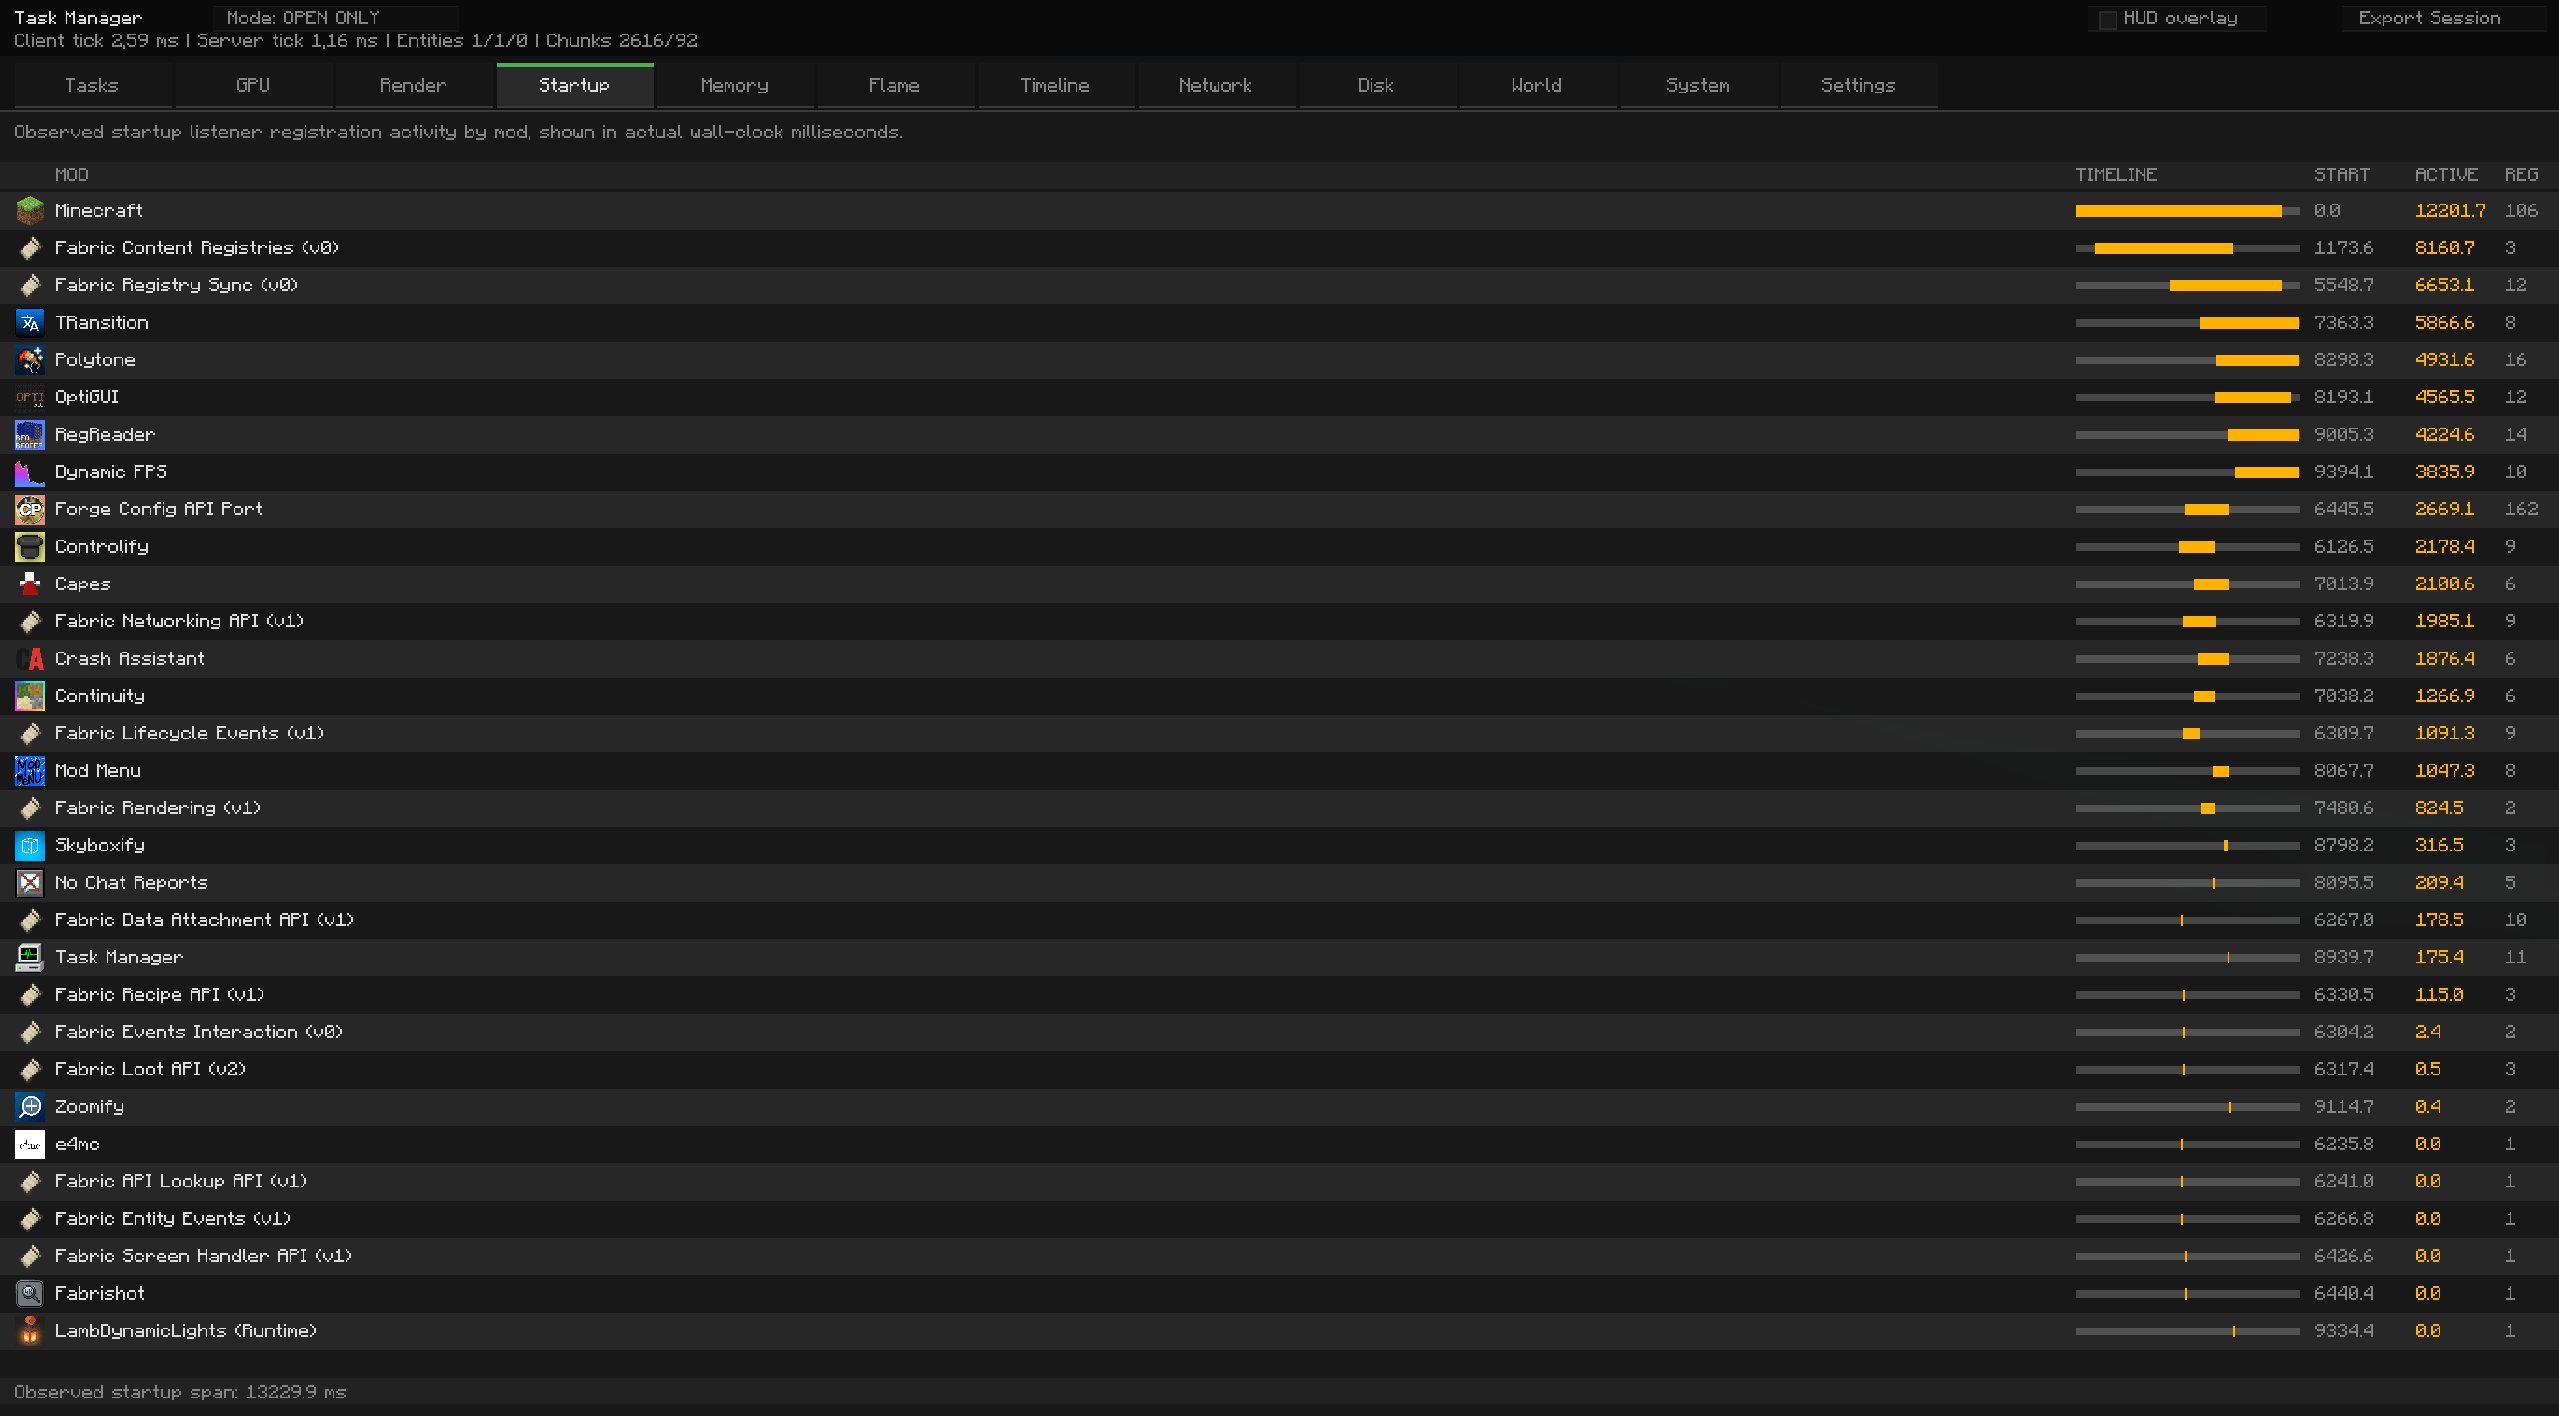
Tasks: per-mod CPU share, sampled threads, sample counts, invokes, filtering, sorting, and row detailGPU: estimated per-mod GPU share, render samples, thread counts, filtering, sorting, and row detailRender: render-phase CPU/GPU timings and call countsStartup: Fabric startup/entrypoint timing by mod in explicit millisecondsMemory: per-mod heap estimates, shared JVM buckets, top classes, filtering, sorting, and shared-family drilldownFlame: sampled stack/flame-style hotspot viewTimeline: frametime, FPS, jitter, variance, frame percentiles, GPU frame time, and MSPT overviewNetwork: inbound/outbound throughput graphs plus packet/category breakdownsDisk: disk read/write throughput graphsWorld: lag map, hot chunks, entity hotspots, and block-entity drilldownSystem: CPU/GPU load, temperatures, thread load, waits/locks, sensors, and runtime diagnosticsSettings: session options, HUD options, and configurable table column visibility

F12: open Task ManagerF11: start/stop session recordingF10: toggle HUD overlayAll keybinds can also be changed in Minecraft controls.
Tasks, GPU, and Memory support:
Settings tabSession exports include a polished summary with:
Task Manager aims to be honest about what is measured versus estimated:
That means the profiler is very useful for finding hotspots and spikes, but some values, especially GPU-per-mod and shared JVM memory, should be interpreted as guidance rather than perfect ground truth.